Regrid between curvilinear grids
[1]:
%matplotlib inline
import matplotlib.pyplot as plt
import cartopy.crs as ccrs
import numpy as np
import xarray as xr
import xesmf as xe
Prepare data
Input data
Here we regrid the built-in “rasm” demo data. This data is used by another xarray tutorial.
[2]:
ds = xr.tutorial.open_dataset(
    "rasm"
)  # use xr.tutorial.load_dataset() for xarray<v0.11.0
ds
[2]:
<xarray.Dataset> Size: 17MB
Dimensions:  (time: 36, y: 205, x: 275)
Coordinates:
  * time     (time) object 288B 1980-09-16 12:00:00 ... 1983-08-17 00:00:00
    xc       (y, x) float64 451kB ...
    yc       (y, x) float64 451kB ...
Dimensions without coordinates: y, x
Data variables:
    Tair     (time, y, x) float64 16MB ...
Attributes:
    title:                     /workspace/jhamman/processed/R1002RBRxaaa01a/l...
    institution:               U.W.
    source:                    RACM R1002RBRxaaa01a
    output_frequency:          daily
    output_mode:               averaged
    convention:                CF-1.4
    references:                Based on the initial model of Liang et al., 19...
    comment:                   Output from the Variable Infiltration Capacity...
    nco_openmp_thread_number:  1
    NCO:                       netCDF Operators version 4.7.9 (Homepage = htt...
history: Fri Aug 7 17:57:38 2020: ncatted -a bounds,,d...It is the surface air temperature data, with nan over the ocean.
[3]:
dr = ds["Tair"]
dr
[3]:
<xarray.DataArray 'Tair' (time: 36, y: 205, x: 275)> Size: 16MB
[2029500 values with dtype=float64]
Coordinates:
  * time     (time) object 288B 1980-09-16 12:00:00 ... 1983-08-17 00:00:00
    xc       (y, x) float64 451kB ...
    yc       (y, x) float64 451kB ...
Dimensions without coordinates: y, x
Attributes:
    units:           C
    long_name:       Surface air temperature
    type_preferred:  double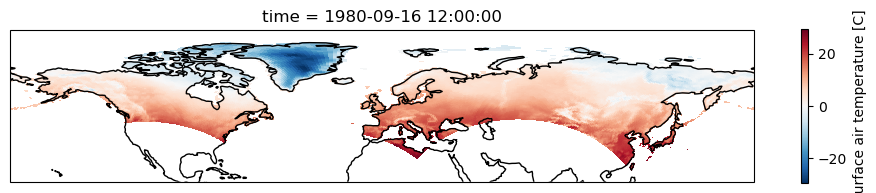
time_rep: instantaneous[4]:
plt.figure(figsize=(12, 2))
ax = plt.axes(projection=ccrs.PlateCarree())
dr[0].plot.pcolormesh(ax=ax, x="xc", y="yc")
ax.coastlines()
[4]:
<cartopy.mpl.feature_artist.FeatureArtist at 0x775e01b9deb0>
Input grid
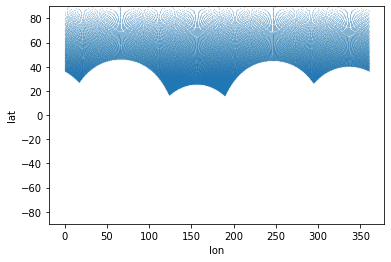
xc and yc are longitude and latitude values. They are both 2D arrays, describing a curvilinear grid over high-latitudes. Note that it is totally fine for a grid to span over the south or north pole. ESMF performs regridding in the Cartesian space (x, y, z) so there will be no polar singularities.
[5]:
plt.scatter(ds["xc"], ds["yc"], s=0.01)  # plot grid locations
plt.ylim([-90, 90])
plt.xlabel("lon")
plt.ylabel("lat")
[5]:
Text(0, 0.5, 'lat')
We need to rename the coordinate names to lon and lat because xESMF has no way to guess variable meaning.
[6]:
ds = ds.rename({"xc": "lon", "yc": "lat"})
ds
[6]:
<xarray.Dataset> Size: 17MB
Dimensions:  (time: 36, y: 205, x: 275)
Coordinates:
  * time     (time) object 288B 1980-09-16 12:00:00 ... 1983-08-17 00:00:00
    lon      (y, x) float64 451kB 189.2 189.4 189.6 189.7 ... 17.4 17.15 16.91
    lat      (y, x) float64 451kB 16.53 16.78 17.02 17.27 ... 28.01 27.76 27.51
Dimensions without coordinates: y, x
Data variables:
    Tair     (time, y, x) float64 16MB ...
Attributes:
    title:                     /workspace/jhamman/processed/R1002RBRxaaa01a/l...
    institution:               U.W.
    source:                    RACM R1002RBRxaaa01a
    output_frequency:          daily
    output_mode:               averaged
    convention:                CF-1.4
    references:                Based on the initial model of Liang et al., 19...
    comment:                   Output from the Variable Infiltration Capacity...
    nco_openmp_thread_number:  1
    NCO:                       netCDF Operators version 4.7.9 (Homepage = htt...
history: Fri Aug 7 17:57:38 2020: ncatted -a bounds,,d...Output grid
Say we want to regrid it to a global \(4^\circ \times 5^\circ\) grid. xESMF provides a shortcut to make this output grid.
[7]:
ds_out = xe.util.grid_global(5, 4)
ds_out  # contains lat/lon values of cell centers and boundaries.
[7]:
<xarray.Dataset> Size: 106kB
Dimensions:  (y: 45, x: 72, y_b: 46, x_b: 73)
Coordinates:
    lon      (y, x) float64 26kB -177.5 -172.5 -167.5 ... 167.5 172.5 177.5
    lat      (y, x) float64 26kB -88.0 -88.0 -88.0 -88.0 ... 88.0 88.0 88.0 88.0
    lon_b    (y_b, x_b) float64 27kB -180.0 -175.0 -170.0 ... 170.0 175.0 180.0
    lat_b    (y_b, x_b) float64 27kB -90.0 -90.0 -90.0 -90.0 ... 90.0 90.0 90.0
Dimensions without coordinates: y, x, y_b, x_b
Data variables:
*empty*The output coordinates are all 2D arrays. They happen to be a rectilinear grid in this case (lat is constant over x axis, and lon is constant over y axis), but you can use 2D arrays to specify any curvilinear grids.
Perform regridding
Regridding is straightforward, just like the previous example.
[8]:
regridder = xe.Regridder(ds, ds_out, "bilinear")
dr_out = regridder(dr)
Check results
Extra dimensions and coordinate values are all correct, like in the previous example.
[9]:
dr_out
[9]:
<xarray.DataArray (time: 36, y: 45, x: 72)> Size: 933kB
array([[[ 0.,  0.,  0., ...,  0.,  0.,  0.],
        [ 0.,  0.,  0., ...,  0.,  0.,  0.],
        [ 0.,  0.,  0., ...,  0.,  0.,  0.],
        ...,
        [nan, nan, nan, ..., nan, nan, nan],
        [nan, nan, nan, ..., nan, nan, nan],
        [nan, nan, nan, ..., nan, nan, nan]],

       [[ 0.,  0.,  0., ...,  0.,  0.,  0.],
        [ 0.,  0.,  0., ...,  0.,  0.,  0.],
        [ 0.,  0.,  0., ...,  0.,  0.,  0.],
        ...,
        [nan, nan, nan, ..., nan, nan, nan],
        [nan, nan, nan, ..., nan, nan, nan],
        [nan, nan, nan, ..., nan, nan, nan]],

       [[ 0.,  0.,  0., ...,  0.,  0.,  0.],
        [ 0.,  0.,  0., ...,  0.,  0.,  0.],
        [ 0.,  0.,  0., ...,  0.,  0.,  0.],
        ...,
...
        ...,
        [nan, nan, nan, ..., nan, nan, nan],
        [nan, nan, nan, ..., nan, nan, nan],
        [nan, nan, nan, ..., nan, nan, nan]],

       [[ 0.,  0.,  0., ...,  0.,  0.,  0.],
        [ 0.,  0.,  0., ...,  0.,  0.,  0.],
        [ 0.,  0.,  0., ...,  0.,  0.,  0.],
        ...,
        [nan, nan, nan, ..., nan, nan, nan],
        [nan, nan, nan, ..., nan, nan, nan],
        [nan, nan, nan, ..., nan, nan, nan]],

       [[ 0.,  0.,  0., ...,  0.,  0.,  0.],
        [ 0.,  0.,  0., ...,  0.,  0.,  0.],
        [ 0.,  0.,  0., ...,  0.,  0.,  0.],
        ...,
        [nan, nan, nan, ..., nan, nan, nan],
        [nan, nan, nan, ..., nan, nan, nan],
        [nan, nan, nan, ..., nan, nan, nan]]], shape=(36, 45, 72))
Coordinates:
  * time     (time) object 288B 1980-09-16 12:00:00 ... 1983-08-17 00:00:00
    lon      (y, x) float64 26kB -177.5 -172.5 -167.5 ... 167.5 172.5 177.5
    lat      (y, x) float64 26kB -88.0 -88.0 -88.0 -88.0 ... 88.0 88.0 88.0 88.0
Dimensions without coordinates: y, x
Attributes: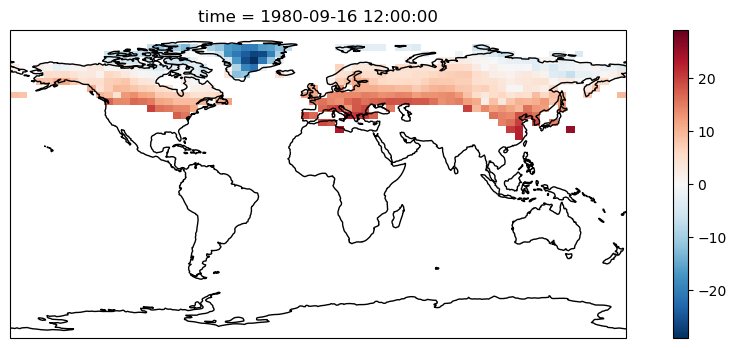
regrid_method: bilinearThe regridding result is consistent with the original data, but now on a rectilinear grid with a coarser resolution. nan is mapped to nan.
[10]:
plt.figure(figsize=(12, 4))
ax = plt.axes(projection=ccrs.PlateCarree())
dr_out[0].plot.pcolormesh(ax=ax, x="lon", y="lat")
ax.coastlines()
[10]:
<cartopy.mpl.feature_artist.FeatureArtist at 0x775df681ec90>
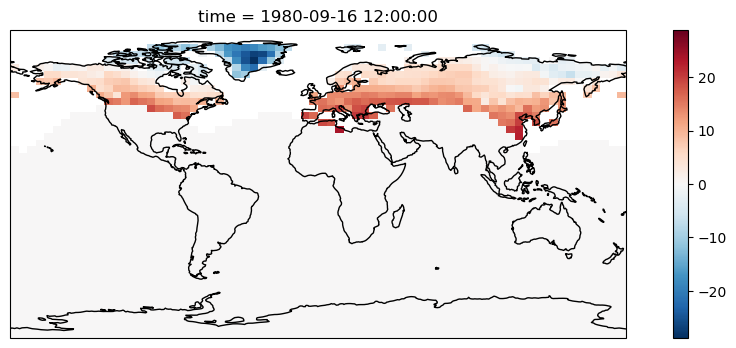
Undesired extrapolation
when using the nearest_s2d method
This section is a short excursion into the masking topic specifically for regional (often curvilinear) source grids. General guidance regarding masking can be found in the general Masking section.
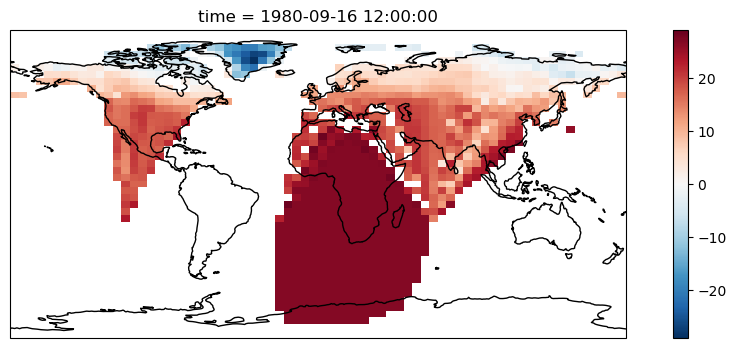
When remapping to a larger domain with the nearest_s2d method, target grid cells outside the original source domain will get the value of the closest source grid cell at the domain edge, owed to the logic behind the nearest_s2d algorithm.
[11]:
# Compute remapping weights with method `nearest_s2d`
regridder_nearest = xe.Regridder(ds, ds_out, "nearest_s2d")

# Remap the data
dr_out = regridder_nearest(dr)

# Plot the result
plt.figure(figsize=(12, 4))
ax = plt.axes(projection=ccrs.PlateCarree())
dr_out[0].plot.pcolormesh(ax=ax, x="lon", y="lat")
ax.coastlines()
[11]:
<cartopy.mpl.feature_artist.FeatureArtist at 0x775df4c3ed20>
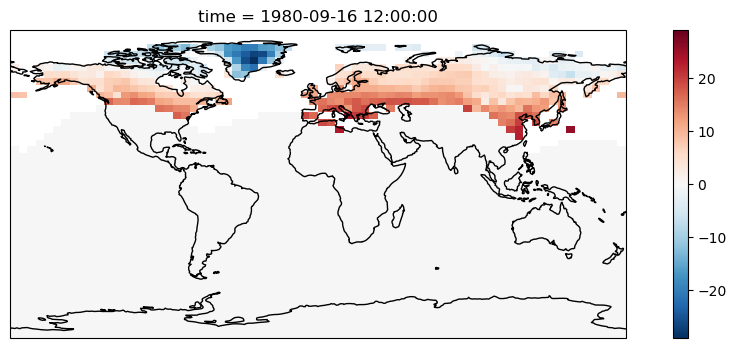
If this is undesired, it can be avoided by including the arguments post_mask_source="domain_edge" (and optionally unmapped_to_nan=True if all unmapped cells should be set to NaN rather than zero) when generating the remapping weights. This will alter the remapping weights after their generation to remove the contribution of the outermost source grid cells of the original domain (i.e. the source grid cells at the domain edge).
Note: While this prevents the often undesired extrapolation artifacts outside the original domain, this means that the information of the source grid cells at the domain edge will be lost in the remapped data.
[12]:
# Compute remapping weights with method `nearest_s2d`
regridder_nearest = xe.Regridder(
    ds, ds_out, "nearest_s2d", post_mask_source="domain_edge"
)

# Remap the data
dr_out = regridder_nearest(dr)

# Plot the result
plt.figure(figsize=(12, 4))
ax = plt.axes(projection=ccrs.PlateCarree())
dr_out[0].plot.pcolormesh(ax=ax, x="lon", y="lat")
ax.coastlines()
[12]:
<cartopy.mpl.feature_artist.FeatureArtist at 0x775df4a5bc80>
Alternatively, one can specify a tailored mask for the target grid. If there is no tailored mask at hand, one could generate it from the bilinear weights:
Generate mask from the bilinear regridding weights (created with active
unmapped_to_nanoption!)
[13]:
# Generate weights
regridder = xe.Regridder(ds, ds_out, "bilinear", unmapped_to_nan=True)

# Generate mask from this weights
mask = xe.smm.gen_mask_from_weights(regridder.weights, nlat=45, nlon=72)
Add the mask to the output
xarray.Dataset
[14]:
ds_out["mask"] = xr.DataArray(dims=("y", "x"), data=mask)
Conduct the remapping as usual
[15]:
# Compute remapping weights with method `nearest_s2d`
regridder_nearest = xe.Regridder(ds, ds_out, "nearest_s2d")

# Remap the data
dr_out = regridder_nearest(dr)

# Plot the result
plt.figure(figsize=(12, 4))
ax = plt.axes(projection=ccrs.PlateCarree())
dr_out[0].plot.pcolormesh(ax=ax, x="lon", y="lat")
ax.coastlines()
[15]:
<cartopy.mpl.feature_artist.FeatureArtist at 0x775df4bc3770>