Using ESMF LocStream objects
(contributed by Raphael Dussin)
ESMF LocStream objects describe a list of geographical points, represented by 1-dimensional arrays of lat/lon coordinates. It is useful for remapping gridded data (e.g. from model output) to/from observation locations, or creating model boundary conditions.
[1]:
import xarray as xr
import xesmf as xe
Remapping from a grid to a LocStream
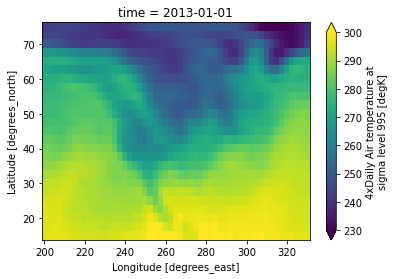
Let’s open a gridded dataset (for example the xarray air temperature dataset):
[2]:
airtemps = xr.tutorial.open_dataset("air_temperature")
[3]:
airtemps["air"].isel(time=0).plot(vmin=230, vmax=300)
[3]:
<matplotlib.collections.QuadMesh at 0x7f0edf4cf4c0>
Now let’s define a list of geographical points (1-D arrays). The name of the dimension used for the LocStream is not important.
[4]:
ds_locs = xr.Dataset()
ds_locs["lon"] = xr.DataArray(
    data=[220, 230, 240, 250, 260, 270], dims=("locations")
)
ds_locs["lat"] = xr.DataArray(data=[20, 30, 40, 50, 60, 70], dims=("locations"))
Creating a Regridder for LocStream object can be done by setting locstream_out or locstream_in (or both) to True. Some algorithms like conservative are not allowed with locstream input/output. See this comment for more discussions.
With locstream_out=True, the regridder behaves like Xarray’s advanced indexing.
[5]:
regridder = xe.Regridder(airtemps, ds_locs, "bilinear", locstream_out=True)
[6]:
airtemps_locs = regridder(airtemps)
using dimensions ('lat', 'lon') from data variable air as the horizontal dimensions for this dataset.
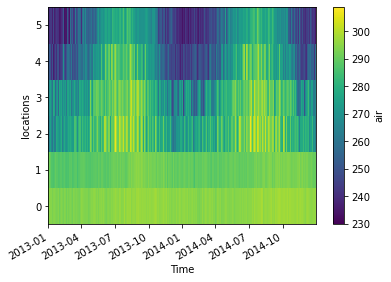
[7]:
airtemps_locs["air"].plot(x="time")
[7]:
<matplotlib.collections.QuadMesh at 0x7f0edf449ca0>

Remapping from LocStream to grid
The opposite transformation is also possible, but only available methods are nearest_s2d and nearest_d2s.
[8]:
regridder_back_s2d = xe.Regridder(
    airtemps_locs, airtemps, "nearest_s2d", locstream_in=True
)
[9]:
airtemps_locs
[9]:
- locations: 6
- time: 2920
- time(time)datetime64[ns]2013-01-01 ... 2014-12-31T18:00:00
- standard_name :
- time
- long_name :
- Time
array(['2013-01-01T00:00:00.000000000', '2013-01-01T06:00:00.000000000', '2013-01-01T12:00:00.000000000', ..., '2014-12-31T06:00:00.000000000', '2014-12-31T12:00:00.000000000', '2014-12-31T18:00:00.000000000'], dtype='datetime64[ns]') - lon(locations)int64220 230 240 250 260 270
array([220, 230, 240, 250, 260, 270])
- lat(locations)int6420 30 40 50 60 70
array([20, 30, 40, 50, 60, 70])
- air(time, locations)float64292.8 288.9 268.1 ... 255.5 236.8
array([[292.79000854, 288.8999939 , 268.1000061 , 269.79000854,
        247.69999695, 247.88999939],
       [293.        , 289.79000854, 262.3999939 , 267.69998169,
        246.        , 246.29998779],
       [292.29000854, 289.5       , 256.69998169, 269.8999939 ,
        244.5       , 243.88999939],
       ...,
       [296.29000854, 290.58999634, 263.19000244, 266.19000244,
        259.79000854, 234.78999329],
       [296.48999023, 289.48999023, 261.08999634, 270.88998413,
        259.98999023, 237.98999023],
       [297.19000244, 289.58999634, 260.79000854, 268.38998413,
        255.48999023, 236.78999329]])
- regrid_method :
- bilinear
[10]:
airtemps_gridded2 = regridder_back_s2d(airtemps_locs)
using dimensions ('locations',) from data variable air as the horizontal dimensions for this dataset.
[11]:
airtemps_gridded2["air"].isel(time=0).plot(vmin=230, vmax=300)
[11]:
<matplotlib.collections.QuadMesh at 0x7f0ede9ecbb0>
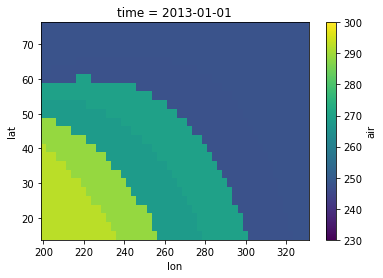
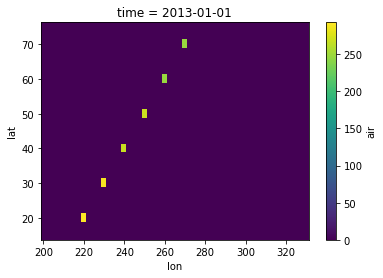
Since we drastically undersampled the original dataset, the reconstruction is very different from the original. The other nearest-neighbor option (d2s) will only map one destination grid point per LocStream point:
[12]:
regrid_back_d2s = xe.Regridder(
    airtemps_locs, airtemps, "nearest_d2s", locstream_in=True
)
[13]:
airtemps_gridded3 = regrid_back_d2s(airtemps_locs)
using dimensions ('locations',) from data variable air as the horizontal dimensions for this dataset.
[14]:
airtemps_gridded3["air"].isel(time=0).plot()
[14]:
<matplotlib.collections.QuadMesh at 0x7f0ede9b19d0>
LocStream to LocStream
It is also possible to remap from one LocStream to another, again only nearest neighbor methods are available.
[15]:
ds_locs2 = xr.Dataset()
ds_locs2["lon"] = xr.DataArray(
    data=[225, 235, 245, 255, 265, 275], dims=("locations")
)
ds_locs2["lat"] = xr.DataArray(
    data=[20, 30, 40, 50, 60, 70], dims=("locations")
)
[16]:
regrid_l2l = xe.Regridder(
    ds_locs, ds_locs2, "nearest_s2d", locstream_in=True, locstream_out=True
)
[17]:
airtemps_locs2 = regrid_l2l(airtemps_locs)
using dimensions ('locations',) from data variable air as the horizontal dimensions for this dataset.
[18]:
airtemps_locs2["air"].plot(x="time")
[18]:
<matplotlib.collections.QuadMesh at 0x7f0ede8f4a00>